OxyPlot在Windows.Forms
date
Nov 4, 2021
slug
10029
status
Published
tags
C#
winform
summary
type
Post
Windows.Forms
Note
This section is under construction. Please contribute!
Create project
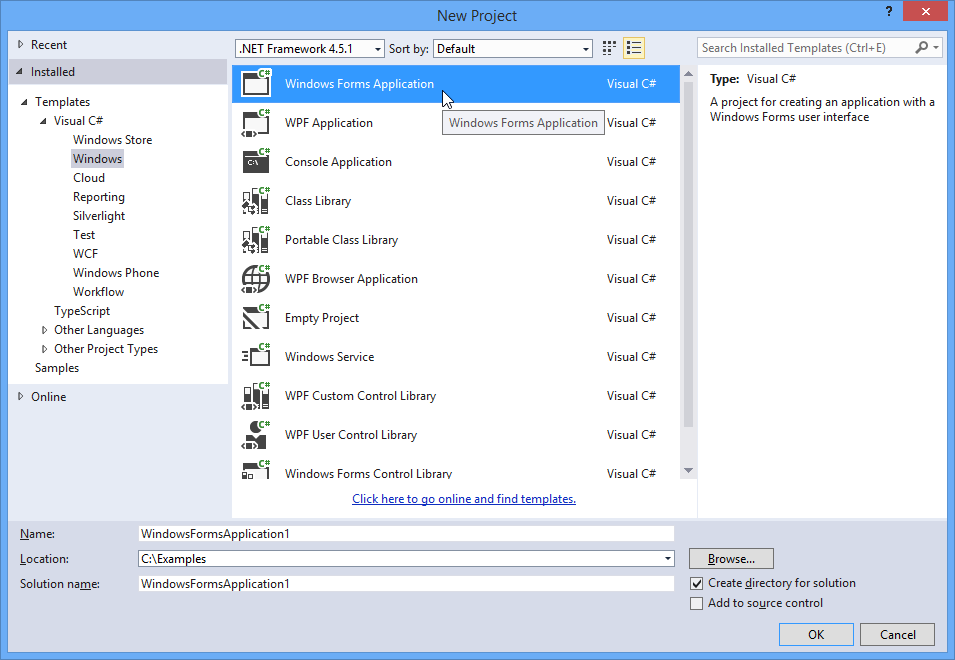
Start Visual Studio and select “FILE -> New -> Project…” to create a new Windows Forms application:

Add references
You need references to the OxyPlot and OxyPlot.WindowsForms assemblies. The easiest way to do this is to right click on the “References” item in the Solution Explorer and select “Manage NuGet Packages…” (this requires that the “NuGet Package Manager” extension is installed):

In the “Manage NuGet packages” dialog, search for “OxyPlot” in the top-right search textbox. Select the “OxyPlot.WindowsForms” package and click install:

You can also use the Package Manager Console to install the package:
PM> Install-Package OxyPlot.WindowsFormsAdd a plot view
TODO (add component to toolbox?)
Create the plot model
namespace WindowsFormsApplication1{
    using System;
    using System.Windows.Forms;

    using OxyPlot;
    using OxyPlot.Series;

    public partial class Form1 : Form
    {
        public Form1()
        {
            this.InitializeComponent();
            var myModel = new PlotModel { Title = "Example 1" };
            myModel.Series.Add(new FunctionSeries(Math.Cos, 0, 10, 0.1, "cos(x)"));
            this.plot1.Model = myModel;
        }
    }
}
The application should now look like this:

The source code can be found in the HelloWorld\WindowsFormsApplication1 folder in the documentation-examples repository.
散点图:
var model = new PlotModel { Title = "ScatterSeries" };
var scatterSeries = new ScatterSeries { MarkerType = MarkerType.Circle };
var r = new Random(314);
for (int i = 0; i < 100; i++)
{
var x = r.NextDouble();
var y = r.NextDouble();
var size = r.Next(5, 15);
var colorValue = r.Next(100, 1000);
scatterSeries.Points.Add(new ScatterPoint(x, y, size, colorValue));
}
       model.Series.Add(scatterSeries);
       model.Axes.Add(new LinearColorAxis { Position = AxisPosition.Right, Palette = OxyPalettes.Jet(200) });

       plotView1.Model = model;